Search Results
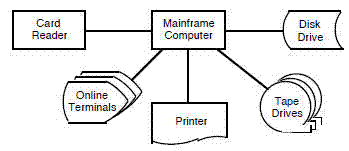
block diagram.
(1)
diagram of a system in which the principal parts or functions are represented by blocks connected by lines that show the relationships of the blocks
(ISO/IEC 2382:2015 Information technology -- Vocabulary)
(2)
diagram of a system, computer, or device in which the principal parts are represented by suitably annotated geometrical figures to show both the functions of the parts and their functional relationships
(ISO/IEC/IEEE 24765:2017 Systems and software engineering-Vocabulary)
Syn: configuration diagram, system resources chart
See Also: box diagram, bubble chart, flowchart, graph, input-process-output chart, structure chart
|
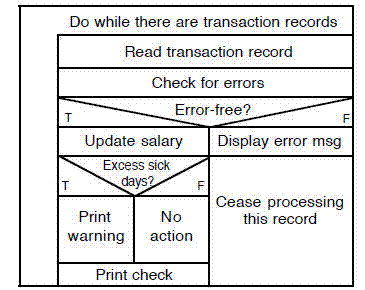
box diagram.
(1)
control flow diagram consisting of a rectangle that is subdivided to show sequential steps, if-then-else conditions, repetition, and case conditions
(ISO/IEC/IEEE 24765:2017 Systems and software engineering-Vocabulary)
Syn: Chapin chart, Nassi-Shneiderman chart
See Also: block diagram, bubble chart, flowchart, graph, input-process-output chart, program structure diagram, structure chart
|
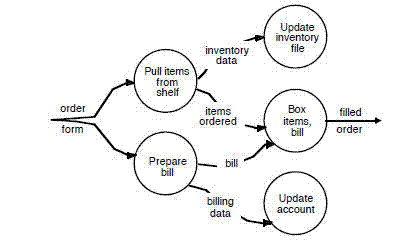
bubble chart.
(1)
data flow, data structure, or other diagram in which entities are depicted with circles (bubbles) and relationships are represented by links drawn between the circles
(ISO/IEC/IEEE 24765:2017 Systems and software engineering-Vocabulary)
See Also: block diagram, box diagram, flowchart, graph, input-process-output chart, structure chart
|
input-process-output (IPO) chart.
(1)
diagram of a software system or module, consisting of a rectangle on the left listing inputs, a rectangle in the center listing processing steps, a rectangle on the right listing outputs, and arrows connecting inputs to processing steps and processing steps to outputs
(ISO/IEC/IEEE 24765:2017 Systems and software engineering-Vocabulary)
Syn: IPO diagram
See Also: block diagram, box diagram, bubble chart, flowchart, graph, structure chart

|
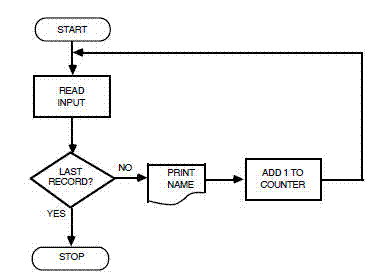
flowchart.
(1)
graphical representation of a process or the step-by-step solution of a problem, using suitably annotated geometric figures connected by flowlines for the purpose of designing or documenting a process or program
(ISO/IEC 2382:2015 Information technology -- Vocabulary)
(2)
graphical representation of the definition, analysis, or method of solution of a problem in which symbols are used to represent operations, data, flow, equipment, etc
(ISO 5807:1985 Information processing -- Documentation symbols and conventions for data, program and system flowcharts, program network charts and system resources charts, 3.3)
(3)
control flow diagram in which suitably annotated geometrical figures are used to represent operations, data, or equipment, and arrows are used to indicate the sequential flow from one to another
(ISO/IEC/IEEE 24765:2017 Systems and software engineering-Vocabulary)
Syn: flow chart, flow diagram
See Also: block diagram, box diagram, bubble chart, graph, input-process-output chart, structure chart
|
|
Obtain ISO Standards
Obtain IEEE Standards
Obtain PMI standards
This definition is
copyrighted ©, 2026 by the IEEE.
The reader is granted permission to copy the definition as long as the statement
"
Copyright©, 2026, IEEE. Used by permission." remains with the definition.
All other rights are reserved.
Copyright © 2026 ISO/IEC.
In accordance with ISO/IEC JTC 1/SC 7 N2882 and N2930, this definition is made publicly available.
Permission is granted to copy the definition providing that its source is cited.
Material reprinted with permission from Project Management Institute, A Guide to the Project Management Body of Knowledge (PMBOK®) Guide - Sixth Edition, 2017.
Copyright and all rights reserved. PMI is a service and trademark of the Project Management Institute, Inc. which is registered in the United States and other nations.
|
